Dynamo: Use Excel Coordinates to Create Model Lines in Revit®
If you have many coordinates in Excel spreadsheet or in other table format, it’s easy to use the power of Dynamo to get those coordinates into Revit®.
In our example, we will use x, y, z coordinates to create model lines within Revit® project.
There are two ways to approach this problem:
- Coordinates represent continuous points (like in polyline)
- There are pairs of coordinates, each pair representing single line
Both examples are displayed in scripts below, with the main difference in the way of cutting list of coordinates.
Download the scripts from here
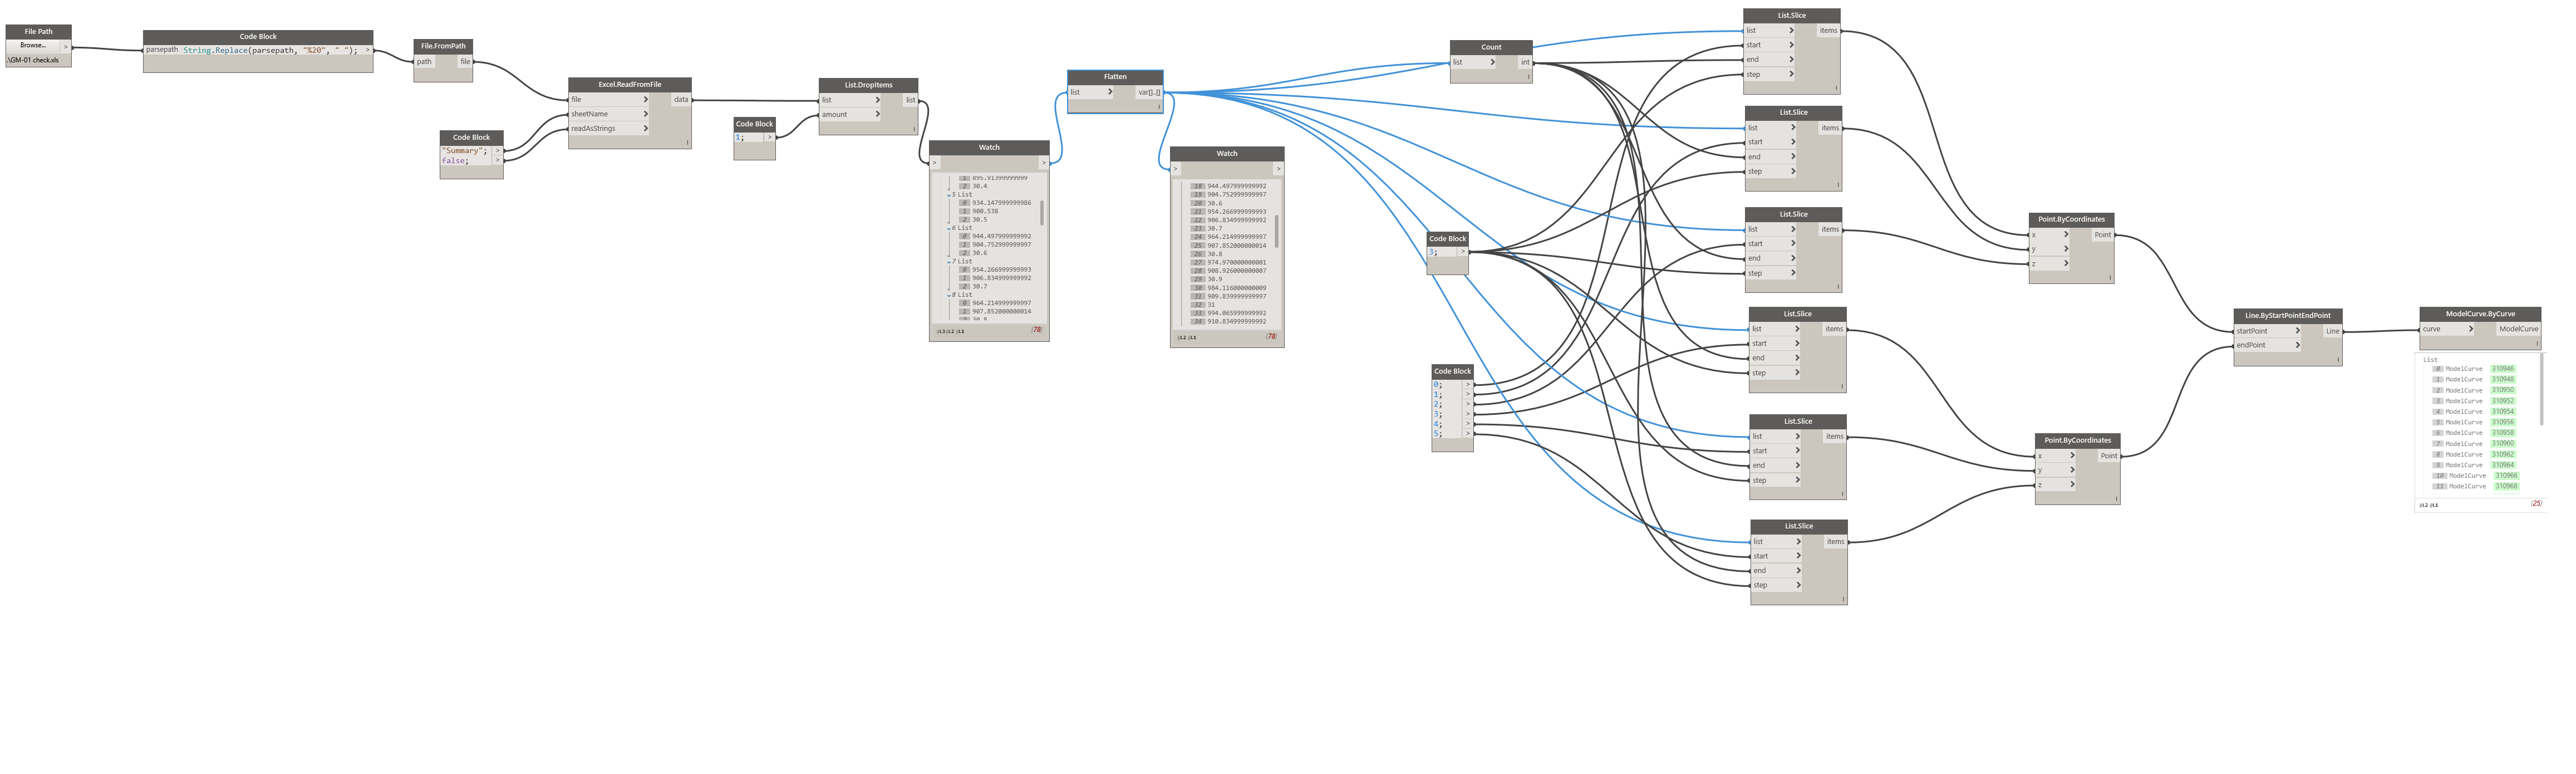
Coordinates represent continuous points (like in polyline)
| Position X | Position Y | Position Z |
| 897.632 | 868.432 | 30 |
| 904.781 | 875.425 | 30.1 |
| 911.929 | 882.418 | 30.2 |
| 919.078 | 889.41 | 30.3 |
| 926.66 | 895.914 | 30.4 |
| 934.148 | 900.538 | 30.5 |
| 944.498 | 904.753 | 30.6 |
| 954.267 | 906.835 | 30.7 |
| 964.215 | 907.852 | 30.8 |
| 974.97 | 908.926 | 30.9 |
| 984.116 | 909.84 | 31 |
(click on the image to enlarge it)
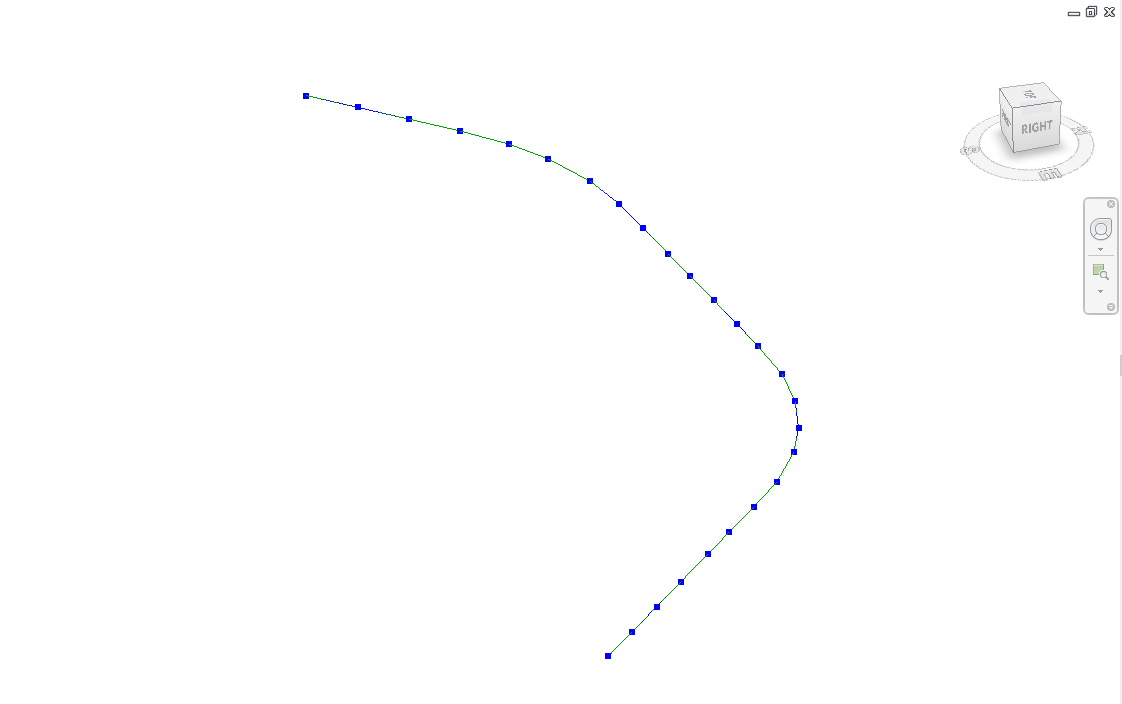
Revit® will result with polyline such as this one:
There are pairs of coordinates, each pair representing single line
The sample table below is used in our example. You can copy paste it into your excel, or create your own.
| x1 | y1 | z1 | x2 | y2 | z2 |
| 0 | 0 | 0 | 5 | 0 | 0 |
| 5 | 0 | 0 | 5 | 5 | 0 |
| 5 | 5 | 0 | 0 | 5 | 0 |
| 0 | 5 | 0 | 0 | 0 | 0 |
| 0 | 0 | 0 | 0 | 0 | 5 |
| 0 | 0 | 5 | 5 | 0 | 5 |
| 5 | 0 | 5 | 5 | 0 | 0 |
| 5 | 0 | 5 | 5 | 5 | 5 |
| 5 | 5 | 5 | 5 | 5 | 0 |
| 5 | 5 | 5 | 0 | 5 | 5 |
| 0 | 5 | 5 | 0 | 5 | 0 |
| 0 | 5 | 5 | 0 | 0 | 5 |
| 0 | 0 | 5 | 2.5 | 0 | 7.5 |
| 2.5 | 0 | 7.5 | 5 | 0 | 5 |
| 0 | 5 | 5 | 2.5 | 5 | 7.5 |
| 2.5 | 5 | 7.5 | 5 | 5 | 5 |
| 2.5 | 5 | 7.5 | 2.5 | 0 | 7.5 |
(click on the image to enlarge it)
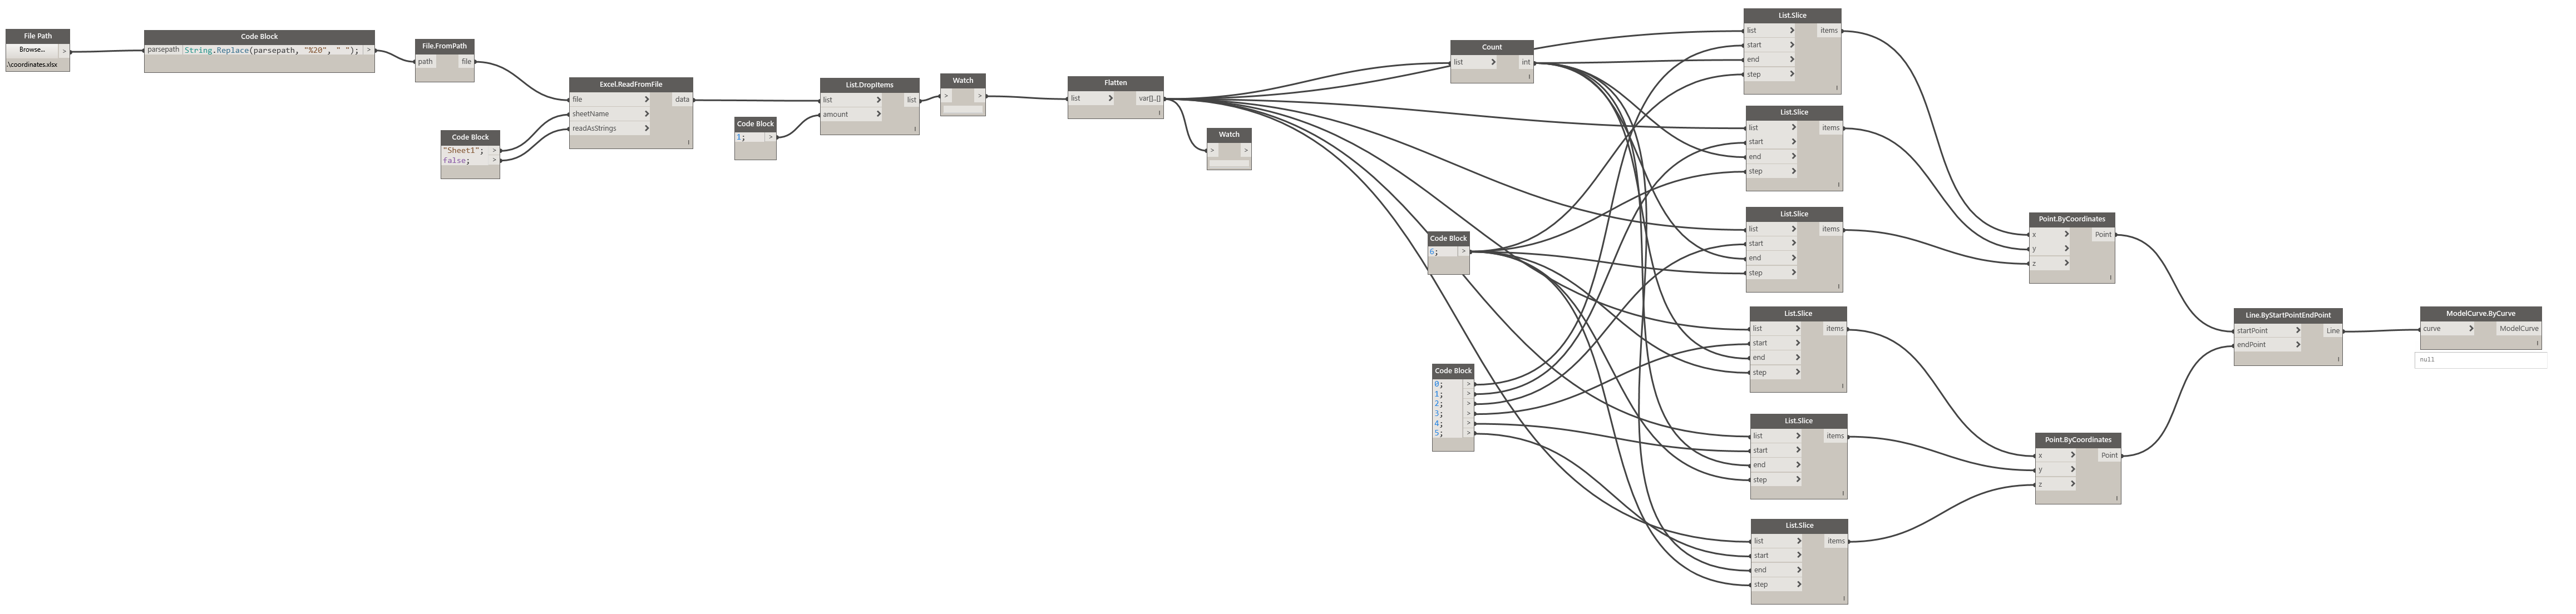
Dynamo will result with this little house:
Hi, I have tried your script, and it’s not working for me. I am pretty much new to the dynamo.